Posted on Monday, June 5th, 2023. Last updated on Saturday, July 20th, 2024

Learn how to perform an independent t-test in SPSS with this step-by-step guide. Understand the process, assumptions, and interpretation of results for comparing two independent groups. Get valuable insights for your research or analysis.
The independent sample t-test is a statistical test used to compare the means of two independent groups. It determines whether there is a significant difference between the means of the two groups based on the assumption that the data in each group is normally distributed.
You should use the independent sample t-test when you want to compare the means of two independent groups on a continuous outcome variable. This test is commonly used in various fields, such as psychology, sociology, and business, to examine group differences.
What are the assumptions of the independent sample t-test?
The independent sample t-test relies on several assumptions, including:
- Normality assumption: The data in each group should be normally distributed.
- Homogeneity of variances assumption: The variances of the two groups should be equal.
- Independence assumption: The observations in each group should be independent of each other.
What is the null and alternative hypothesis in the independent sample t-test?
The null hypothesis in the independent sample t-test states that there is no significant difference between the means of the two independent groups. In other words, the population means are equal.
The alternative hypothesis in the independent sample t-test states that there is a significant difference between the means of the two independent groups. It suggests that the population means are not equal.
Preparing Data for Independent t-test in SPSS
Importing your data into SPSS
To perform an independent t-test in SPSS, you first need to import your data into the software. Here are the steps to do it:
- Launch SPSS and open a new or existing project.
- Go to “File” in the menu bar and select “Open” to locate your data file.
- Choose the appropriate file format (e.g., Excel, CSV) and click “Open.”
- Follow the prompts to import your data into SPSS.
Checking for data accuracy and completeness
Before conducting any statistical analysis, it is crucial to ensure the accuracy and completeness of your data. Here are some steps to take:
- Examine your variables and their labels to ensure they match your research objectives.
- Look for missing values or inconsistencies and handle them appropriately (e.g., impute missing data, exclude cases).
- Verify the data range and make sure it aligns with your research context.
Identifying and dealing with missing values
Missing values can impact the accuracy and reliability of your results. It is essential to identify and handle them appropriately. Here’s how:
- Use SPSS’s “Missing Values” option under the “Transform” menu to define missing value codes.
- Consider different strategies to handle missing values, such as imputation or excluding cases based on specific criteria.
- Document the method used to handle missing values for transparency and reproducibility.
Grouping your data according to the independent variable
In an independent sample t-test, you have two groups defined by your independent variable. To prepare your data for the analysis, follow these steps:
- Create a new variable in SPSS that represents your independent variable.
- Assign appropriate values or labels to differentiate between the two groups.
- Ensure that the group variable is correctly coded for each case in your dataset.
“Need SPSS help? Look no further! At BestWritingBay, we specialize in providing top-notch assistance with all your SPSS needs. Our team of experienced professionals is ready to guide you through data analysis, interpret results, and troubleshoot any SPSS-related challenges you may encounter. Don’t let SPSS complexities hold you back, let us be your trusted partner in achieving statistical success.”
Performing the Independent t-Test in SPSS
Running the independent sample t-test in SPSS
Once your data is prepared, you can proceed with running the independent t-test in SPSS. Here’s how to do it:
- Go to “Analyze” in the menu bar and select “Compare Means,” then choose “Independent-Samples t-test.”
- In the “Independent-Samples t-test” dialog box, select the dependent variable you want to compare.
- Move the independent variable into the “Grouping Variable” box.
- Click “OK” to run the independent sample t-test.
Interpreting the SPSS output
After running the independent t-test in SPSS, SPSS will generate an output with various statistics and tables. Here’s what to look for and interpret:
- Descriptive statistics: Review the mean, standard deviation, and sample size for each group.
- Independent sample t-test results: Focus on the t-value, degrees of freedom, and p-value.
- Effect size measures: Consider the effect size measures like Cohen’s d or Hedges’ g to understand the magnitude of the difference between the groups.
Understanding the t-value and degrees of freedom
In the independent sample t-test output, the t-value represents the ratio of the difference between the sample means to the standard error of the difference. The degrees of freedom indicate the number of values free to vary in the estimation of a statistical parameter. Both these values play a crucial role in determining the statistical significance of the test.
Analyzing the p-value and making conclusions
The p-value in the independent sample t-test indicates the probability of obtaining the observed difference between the groups due to random chance alone. To draw conclusions, consider the following guidelines:
- If the p-value is less than the chosen significance level (e.g., p < 0.05), you can reject the null hypothesis and conclude that there is a significant difference between the group means.
- If the p-value is greater than the significance level, there is insufficient evidence to reject the null hypothesis, suggesting that there is no significant difference between the group means.
“Unlock the power of SPSS with our expert assistance. From guiding you through independent t-test in spss to providing comprehensive support for your data analysis needs, BestWritingBay is here to help. Place an order today and let our skilled team navigate you through the intricacies of SPSS, ensuring accurate and insightful results every step of the way.”
Example: Independent t-Test in SPSS
Research question and hypothesis
Let’s consider an example to illustrate the application of the independent sample t-test. Suppose we want to investigate whether there is a significant difference in the scores of two types of vehicle treads. Our research question is: “Do tread A has significantly better scores than tread B?
Data description and group formation
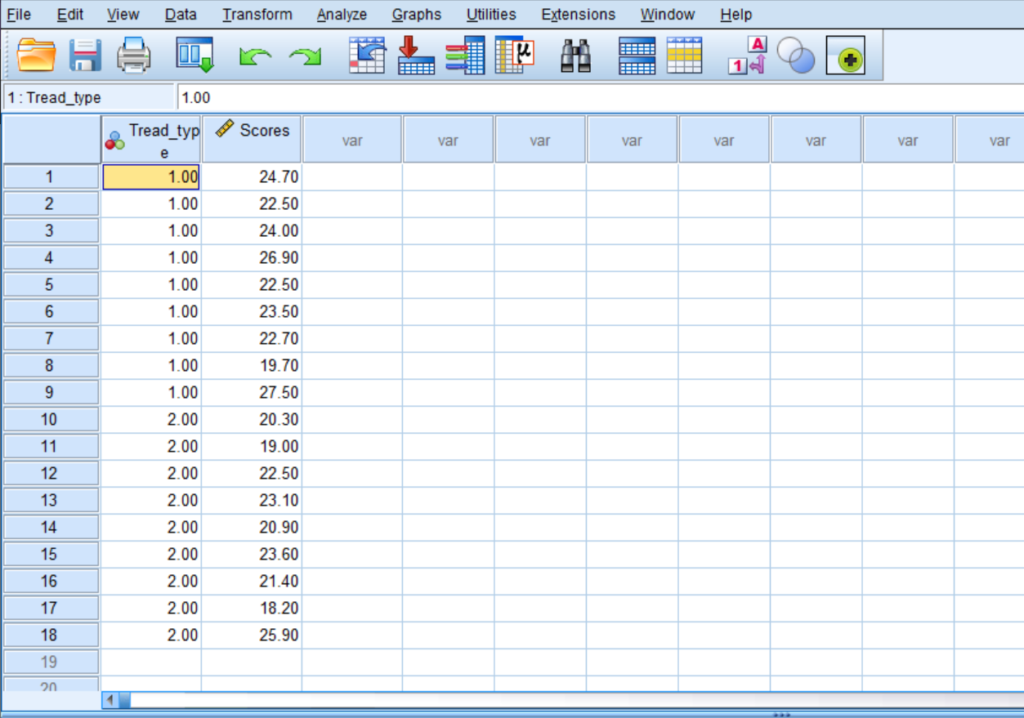
We collect data from 18 cars, 9 from each group. The test scores range from 15 to 30. In SPSS, we code Tread A as 1 and Tread B as 2 in a new variable called “Tread_Type.” We also have a variable called “Scores” that contains the car tread scores.

Running the independent sample t-test
To perform the independent t-test in SPSS, we follow the steps outlined earlier. We select “Scores” as the dependent variable and “Tread_type” as the grouping variable. This is shown in the following video.
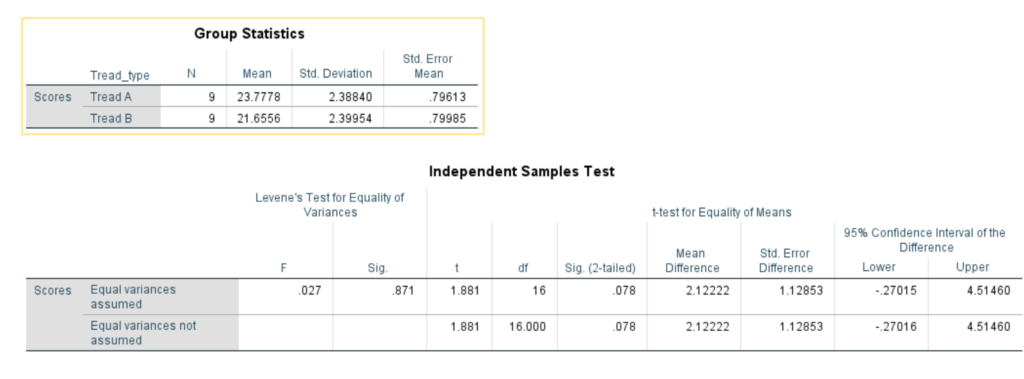
After running the analysis, we obtain the output.

Interpreting the results and drawing conclusions
Upon analyzing the output, we find that the mean score for Tread A is 23.78, while for Tread B, it is 21.66. The independent sample t-test reveals a t-value of 1.88 and a p-value of 0.078. Since the p-value is greater than 0.05, we fail to reject the null hypothesis and conclude that there is no significant difference in scores between .
Assumptions of the Independent Sample t-Test
Normality assumption
The independent sample t-test assumes that the data in each group follows a normal distribution. You can visually assess this assumption by creating histograms or Q-Q plots. Additionally, you can use statistical tests like the Shapiro-Wilk test to formally test for normality.
Homogeneity of variances assumption
The assumption of homogeneity of variances states that the variances of the two groups being compared should be equal. Violations of this assumption can lead to inaccurate results. To assess homogeneity of variances, you can use Levene’s test or examine boxplots.
For instance, the the above spss output, the levene’s test shows that the test statistics, F = 0.027 and p-value = 0.871.
Here, we are testing the hypotheses:
H0: The variances are equal
H1: The variances are not equal
Now, since the p-value is greater than the 0.05 significance level, we fail to reject the null hypothesis. Thus, the assumption of homogeneity of variance that assumes that variances are equal is met.
Independence assumption
The independent sample t-test assumes that the observations within each group are independent of each other. Independence implies that the values in one group are not influenced by or related to the values in the other group.
Checking Assumptions of Independent t-test in SPSS
Checking normality using histograms and Q-Q plots
In SPSS, you can create histograms and Q-Q plots to visually assess the normality assumption. Here’s how to do it:
- Go to “Graphs” in the menu bar and select “Legacy Dialogs,” then choose “Histogram.”
- In the “Histogram” dialog box, select the variable for each group and check the option for displaying normal curves.
- Click “OK” to generate the histograms.
- Repeat the steps for Q-Q plots, selecting “Q-Q Plot” from the “Legacy Dialogs” menu.
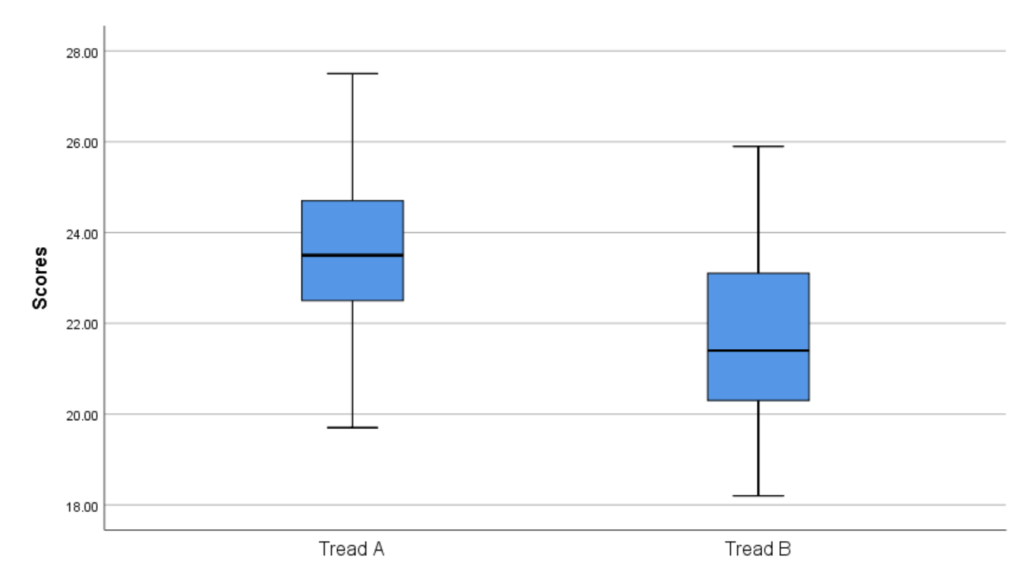
You will obtain the following results for histogram and boxplot:


Assessing homogeneity of variances using Levene’s test
To assess the assumption of homogeneity of variances using Levene’s test in SPSS, follow these steps:
- Go to “Analyze” in the menu bar and select “Descriptive Statistics,” then choose “Explore.”
- In the “Explore” dialog box, select the dependent variable and move the grouping variable into the “Factor” list.
- Click on “Plots” and check the option for “Descriptive” and “Test Homogeneity of Variances.”
- Click “OK” to run the analysis, and the output will include Levene’s test for homogeneity of variances.
Testing for independence
The independence assumption is often assumed in the design of the study or data collection process. However, you can check for any potential violations by examining the study design and data collection procedures.
Reporting the Independent Sample t-Test Results
Structuring the results section
When reporting the results of an independent sample t-test, follow a structured format that includes:
- A brief introduction stating the research question and the purpose of the analysis.
- Descriptive statistics, such as means, standard deviations, and sample sizes for each group.
- The independent sample t-test results, including the t-value, degrees of freedom, and p-value.
- Effect size measures, if applicable, such as Cohen’s d or Hedges’ g.
Presenting descriptive statistics
The descriptive statistics provide a summary of the data for each group. Here’s an example of how to present them: “Tread A (M = 23.78, SD = 2.39, N = 9) did not had significantly higher mean score than Tread B (M = 21.66, SD = 2.40, N = 9).”
Reporting the independent sample t-test
When reporting the independent sample t-test results, include the key information: “The independent sample t-test did not reveal a significant difference in scores between Tread A and Tread B (t(16) = 1.88, p = 0.08).”
Frequently Asked Questions (FAQs)
Yes, you can still perform the independent sample t-test if your data deviates slightly from normality. The t-test is robust to violations of normality, especially when the sample sizes are large. However, for smaller sample sizes or substantial departures from normality, consider using non-parametric tests, such as the Mann-Whitney U test.
If your data violates the assumption of homogeneity of variances, you can apply a Welch’s t-test instead of the traditional independent sample t-test. Welch’s t-test does not assume equal variances and is more appropriate when the variances differ significantly between the groups.
To calculate the effect size in the independent sample t-test, you can use measures like Cohen’s d or Hedges’ g. These measures quantify the magnitude of the difference between the group means. SPSS does not provide effect size measures directly in the t-test output, but you can compute them using formulas or statistical software.
Yes, you can perform an independent test in spss with unequal sample sizes. SPSS automatically adjusts for unequal sample sizes and calculates the correct degrees of freedom. However, keep in mind that larger sample sizes provide more accurate estimates and increase the power of the test.
No, the independent sample t-test is one of several statistical tests to compare two groups. Other tests, such as the paired sample t-test, chi-square test, or Mann-Whitney U test, may be more suitable depending on the nature of your data and research question. Choose the appropriate test based on the characteristics of your study.
No, the independent sample t-test is specifically designed to compare the means of two independent groups. If you have more than two groups, consider using analysis of variance (ANOVA) or other appropriate multigroup statistical tests.
The independent sample t-test is a valuable statistical test for comparing the means of two independent groups. By following the step-by-step guide of performing independent t-test in SPSS, you can easily perform and interpret the results of the t-test. Remember to check the assumptions, report the descriptive statistics, and consider effect size measures to enhance the understanding of your findings. Whether you’re a researcher, student, or business professional, mastering the independent sample t-test will empower you to make evidence-based decisions and draw meaningful conclusions from your data. You can also buy our spss data analysis services if you are struggling with data analysis for your thesis, dissertation paper or any coursework assignment.


